
For data analyst freelance services contact me [email protected]
What is a KPI report?
A KPI report is a report that summarizes the key performance indicators (KPIs) that are relevant to the company. A successful KPI report allows you to quickly see whether the company is meeting the goals it has set for itself.
The process of creating a KPI report.
In order for the data analyst to create a KPI report, they need to know what are the company’s goals or, in other words, what are the KPIs (Key Performance Indicators) the company wants to measure.
Every company has goals they want to achieve, so determining the KPIs to measure should be a simple task. However, in practice, when the data analyst asks managers to specify the goals for KPIs in quantitative terms, the task becomes complex and can even start a deep process of strategic thinking about the direction the company is heading.
Operational definition of KPIs.
Let’s assume for a moment that we have determined that one of the important goals for the company is to acquire new customers. From here the question arises: how do we define a new customer? Is a customer who used our product or service once and did not return considered a new customer? Or maybe only a customer who used it at least twice in the first three months since registration is considered a new customer?
Another issue in measuring goals is choosing the statistical measure for the goal. For example, if it is determined that it is important for the company to track revenue from customers, do we want to know the average revenue from a customer or do we prefer to use the median? If the data analyst chooses the mean, it may be distorted when the distribution is not homogeneous, as if there is very high revenue from a small number of customers, the average will jump up while the revenue from most customers will be lower.
Setting a time frame for a report
Every report is characterized by a time frame to which the data refers. There are reports in which the data is updated on a monthly, weekly, or daily basis. Typically, KPI reports are monthly, and the KPIs will relate to the specific month covered in the report. For example, in a report for November 2019, we will see the number of active users in November 2019.
Characteristics and Segmentation
Setting goals alone is not enough. The goals we set should be segmented according to customer characteristics, and therefore we need to determine what are the important characteristics for the company. Characteristics can be gender, country, organic traffic, and so on.
Comparisons and goal attainment
It is difficult to draw conclusions from KPI metrics alone, so it is always advisable to compare them to the KPIs of the previous month or the previous season so that we can understand the context of the monthly results. They can also be compared to pre-defined goals, for example – whether this month’s sales turnover exceeded one million shekels. The choice of which reference point to use to compare the metrics depends on the business environment. In the tourism industry, for example, it is customary to compare the data to the same month in the previous year because customers behave differently in each month throughout the year.
Trends / Trend Graph
Sometimes, comparing KPIs to the previous month’s result does not give us the full picture. Therefore, in addition to comparison, it is possible to choose several metrics (or even all of them) and plot the trend graph of the past year or two. Adding a trend graph to the KPI measure provides a broader context for understanding the monthly result.
Visual Display
There are endless possibilities and plenty of room for creativity when presenting a KPI report, and the data analyst’s task is to take all the information from the databases using complex queries and to build the report from the results in a clear and pleasant way that will enable easy and quick understanding of the company’s situation.
In the following sections, I have chosen a few visual examples that can be learned from. The examples were created in the Power BI tool, which is an excellent tool for building KPI reports, but there are also other good tools.
Presentation of KPI metrics.
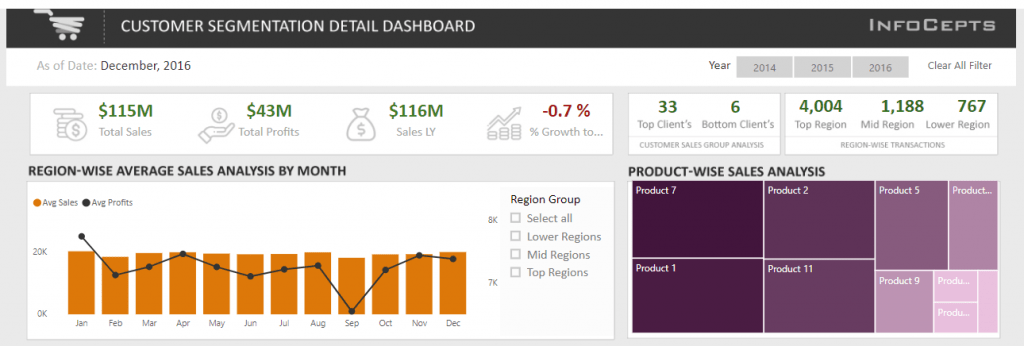
In this report, you can see the main metrics in the first row. Note that the metrics are colored green or red according to whether they have increased or decreased compared to the previous month.
In addition, the report also includes a trend line of revenue over the past year.
You can access the report itself and disaggregate the metrics by clicking on the segments (in Power BI, click on a column of a feature in the graph, which usually filters the report by that feature).
https://community.powerbi.com/t5/Data-Stories-Gallery/Customer-Analysis-Dashboard/td-p/630893
Metrics box.
The following report demonstrates the idea of a “metrics box”.
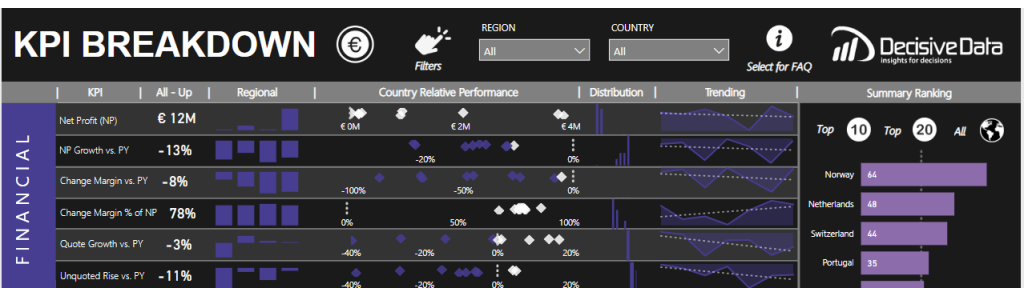
A metrics box is a table of KPIs. Each KPI has a row that displays its value, comparisons, and even a trend line. This trend line is called a sparkline and in the current report, it appears under the heading Trending.
Link to the full report:
In summary
a KPI report is a report that centralizes the key metrics that are important to the company. It should be concise so that a quick glance can provide a snapshot of the current state of affairs.
In the process of creating the report, strategic thinking is required regarding the important objectives of the company. In addition to writing queries and creating the report itself using visualization tools, there are other elements in the report that need to be taken into account, such as the time window that the report presents, the characteristics that need to be segmented, and the selection of trend lines that need to be viewed.
In this article, I focused on the KPI report of companies, but in fact, every department in a large organization can be considered a company and can create a KPI report according to its own objectives.
This article was written by Yuval Marnin.
Do you need a data analyst to create KPI reports for your company? Feel free to contact me at [email protected]
You may also hire me through upwork platform on that link:
https://www.upwork.com/freelancers/~018940225ce48244f0\