Improving Profitability in Gaming and Social Casino Companies with BI Reports
What Are BI Reports?
BI (Business Intelligence) reports follow the company’s most important metrics (KPIs) and present it in a clear, visual format using charts, tables, and dynamic dashboards. A high-quality BI report provides an up-to-date view of company profitability, identifies trends in key metrics, and enables deep analysis across important segments such as players, affiliate sources, games, and more.
When built correctly, BI reports allow managers to quickly gain insights, identify issues, and make data-driven business decisions. With the advancement of AI and data science technologies, BI reports can also deliver advanced analytical insights that are not immediately visible at first glance.
BI Reports for the Gaming and Social Casino Industry
Building BI reports for the gaming and social casino industry requires a strong understanding of domain-specific metrics. Key metrics include deposits, withdrawals, RTP (Return to Player), and revenue per game. Combining these metrics with relevant business segmentation provides an accurate picture of casino performance and enables continuous optimization of profitability.
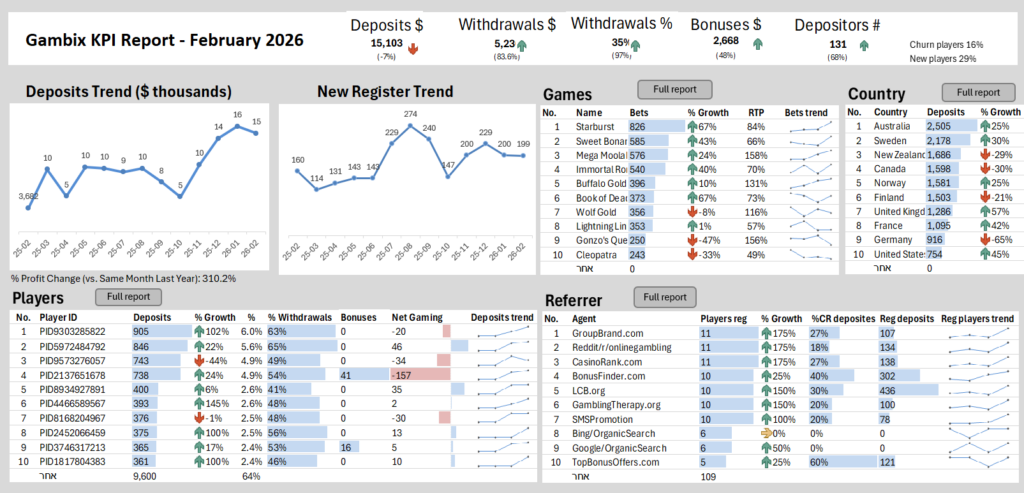
Example of BI report for Social casino
How Are BI Reports Created for Gaming?
There are two main approaches to creating BI reports in the gaming industry. The first approach involves building a full BI system using tools such as Tableau or Power BI connected to a centralized data warehouse. This solution offers full customization, advanced analytics, and flexible querying capabilities, but comes with high implementation costs and requires ongoing maintenance and dedicated analysts.
The second approach relies on built-in reports provided by gaming platforms such as Patriana, Soft2Bet, and others. This is a faster and more cost-effective solution, but it is limited in flexibility and often cannot address all business questions.
Alongside these approaches, there is a third solution, the one I offer. Using a system I developed, companies can generate highly customized BI reports without the need to build a full BI infrastructure or hire analysts.
How Does It Work?
Gaming platforms provide monthly data files in CSV or Excel format that reflect player activity. These datasets can serve as the source for in-depth analysis and valuable business insights.
I analyze the data using statistical algorithms combined with Python and SQL, and present the results in a well-designed Excel-based BI report. The outcome is a clear, intuitive, and easy-to-use report that enables fast understanding of business performance and supports better decision-making.
Advantages and Limitations
This solution significantly reduces costs compared to building a full BI system and does not require complex infrastructure or long implementation processes. It also offers full customization based on business needs.
However, it is important to note that the reports are not real-time and are based on monthly data. Additionally, there are some limitations regarding the types of metrics that can be calculated.
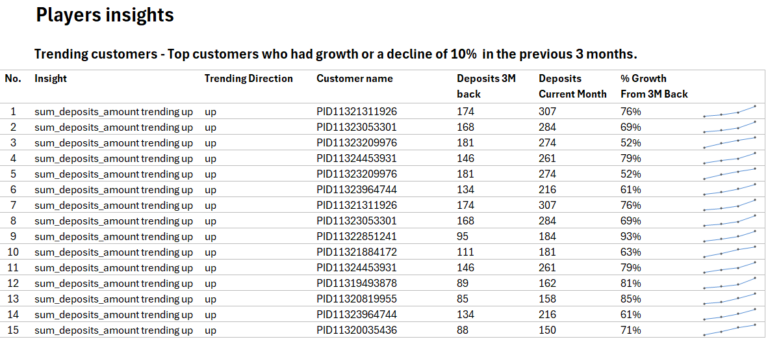
Example of a report on customers who consistently increase their monthly deposit amounts
Who Is This Solution For?
This solution is ideal for small to mid-sized gaming and social casino companies, organizations without an in-house BI team, and businesses looking to extract more value from their existing data without investing in heavy infrastructure.
It supports multiple platforms such as Patriana, Soft2Bet, SoftSwiss, and others. It is also suitable for companies with a small data warehouse that prefer not to build reports or hire analysts.
How Does the Solution Work in Practice?
The process is simple and efficient. To generate the reports, all that is required is to export a monthly data file in Excel or CSV format from the casino platform. Once the file is received, I perform advanced data processing and analysis, and deliver a fully structured Excel-based BI report that is ready to use, clear, and easy to navigate.
The solution also places strong emphasis on players privacy. There is no need to share player names or any personally identifiable information. The analysis can be performed using only anonymous identifiers such as player IDs, without exposing any sensitive personal data.
What’s Included in the Reports?
The main BI report is a monthly report that provides a comprehensive overview of business performance. It includes analysis of deposits and withdrawals, game-level profitability, player segmentation, and affiliate performance.
In addition, the reports help identify churned players, detect trends in the data, and uncover opportunities for growth. Each report is fully customizable based on the client’s specific KPIs and business needs.
Example of churn players reports

About
My name is Yuval Marnin, a data analytics and BI expert with over 15 years of experience. I help companies transform raw data into actionable insights that drive real business value and increase profitability.
Contact
For a demo or more information, feel free to reach out:
[email protected]