BI reports for without external BI systems
What are BI reports?
BI reports consolidate a company’s most important data (KPIs) and present it visually through charts, tables, and dynamic dashboards. A high-quality BI report provides an up-to-date snapshot of the company’s profitability, trends in key metrics, and breakdowns by business-critical segments (such as branches, sales agents, products, etc.).
When a BI report is built correctly, it enables managers to quickly and easily derive insights and answer business questions that support better decision-making. With the advancement of AI, BI reports can now deliver advanced analytical insights that are not immediately visible at first glance.
For example, identifying a niche product whose sales have suddenly surged due to a trend gaining traction on social media.
BI reports can be created using tools such as Power BI, Tableau, Qlik Sense, and even Excel.
Can BI reports be created on ERP systems?
ERP systems include basic management reports, but these reports often don’t fully answer the complex business questions that arise in day-to-day operations. As a result, there is a need to develop external BI reports that complement the ERP system.
Managers in companies using these systems often knows that producing management reports and in-depth analyses requires building complex and expensive BI infrastructures.
Indeed, in some cases a dedicated BI environment is needed for dashboards and deep analysis. However, I offer a more efficient and cost-effective solution: analytical BI reports provided as an external service, without the need for costly BI infrastructure.
To produce the reports, I use statistical algorithms that I developed in Python, along with additional advanced analytics tools that provide capabilities that are difficult to achieve with traditional BI platforms. The results of the analysis are then exported into BI reports in Excel.
Who is this service for?
The reports are suitable for managers, marketing professionals and sales representatives who have an ERP system or a database that allows exporting sales data from recent months.
Supported systems include:
The reports can also be produced for companies that already have an existing database or BI systems.
How can BI reports be produced without external systems?
To generate the reports, all that is required is to export a monthly Excel or CSV file from the ERP system containing the purchasing and activity data and send it to me for processing. Since the processing is performed on data stored within the ERP system or an internal database, there is no need to set up a dedicated database or maintain a complex system.
After processing the data, you will receive an Excel-based BI report that is ready to use and easy to operate.
What is included in the BI reports?
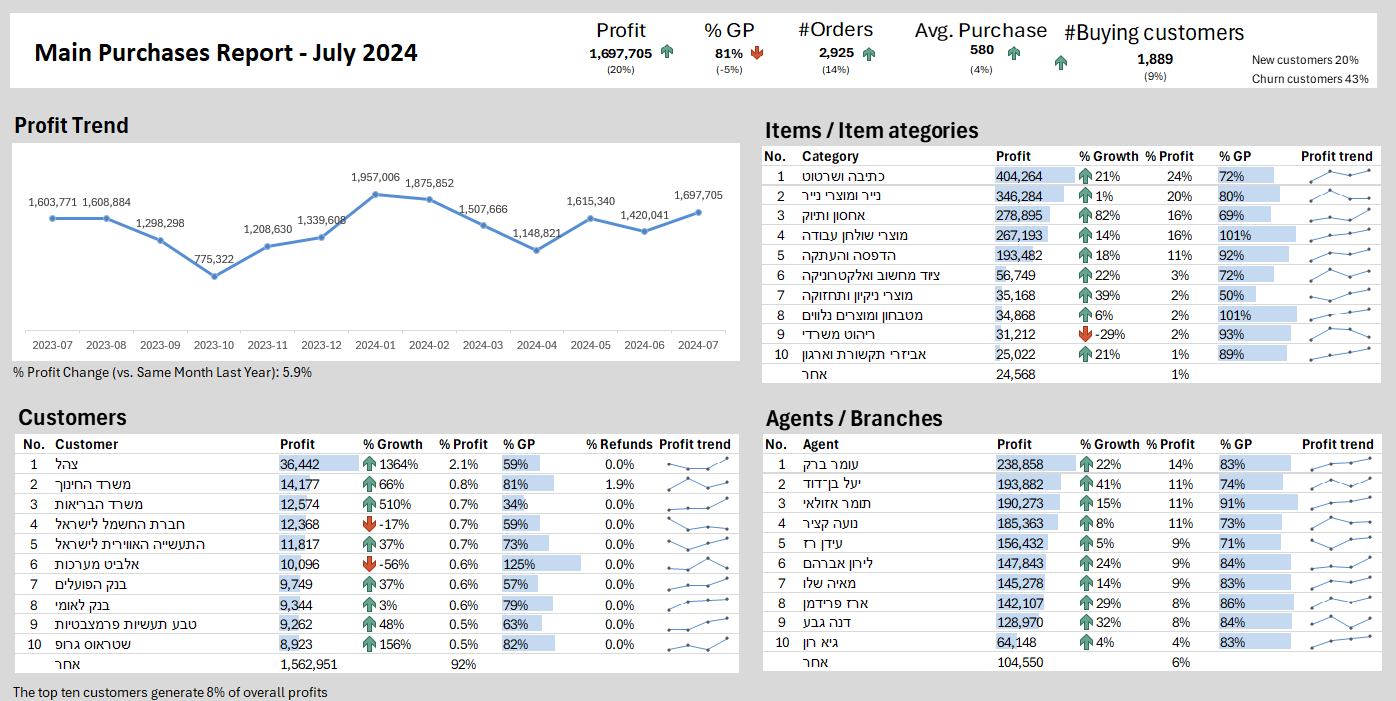
The main BI report is a monthly report that details the key metrics related to sales and customers who made purchases and activity during the month. It provides a comprehensive and up-to-date overview of the company’s sales activity. The report tracks various profitability metrics, such as revenue and gross profit, and enables in-depth analysis across multiple dimensions, including customers, products, and sales agents. This makes it possible to identify trends, performance gaps, and opportunities for improvement.
The report serves as a central decision-making tool for managers and business owners, presenting a clear and transparent view of the company’s profitability and the key factors influencing it. In addition, it helps identify strengths and weaknesses, as well as areas that require attention, improvement, or optimization.
The report also includes supporting sub-reports with full details of all customers who made purchases during the month, detailed product-level data, churned customers, and additional breakdowns tailored to the company’s specific business needs.
Report Customization
It is important for every company to track different metrics and analyze data according to the segments relevant to its operations. For example, companies engaged in product sales will want to focus on metrics such as gross profit, while companies specializing in delivery will be interested in metrics like average delivery time. In addition, some companies may want to measure the performance of their sales agents, while others may prefer to analyze success by geographic region or the customer’s city of residence.
The reports I produce are fully customizable for any business environment and include the creation and definition of metrics and breakdowns tailored to each company’s specific needs and areas of focus.
Advanced Analytical Reports
Example of BI report
About me
My name is Yuval Marnin, and I am a data analysis, and BI reporting expert with over 15 years of experience.
Throughout my career, I have worked across various industries, including fintech, retail, transportation, and more. I have gained extensive experience working with large retail companies, small startups, and venture-capital firms, specializing in turning data into meaningful business insights.
From my broad experience in data analysis, I believe that companies can extract significant value from the data already available in their ERP systems — even if they do not have a complex or expensive BI infrastructure.
For inquiries and service demonstrations, you can contact me at:
Q & A
What is required in order to receive the BI reports?
To get the BI reports, you need to export the sales data from your ERP system.
Do I need to commit to a specific time period to receive the BI reports?
No commitment is required, you may end the engagement at any time.
If I already have a database and a BI system, can I still get the service?
Of course! All that is required is to generate a detailed sales report from your database or ERP system, and based on that, you can receive the service and the reports.
For inquiries and service demonstrations, you can contact me at: